Data Analysis
|
Student Guided Reading Level Data
|
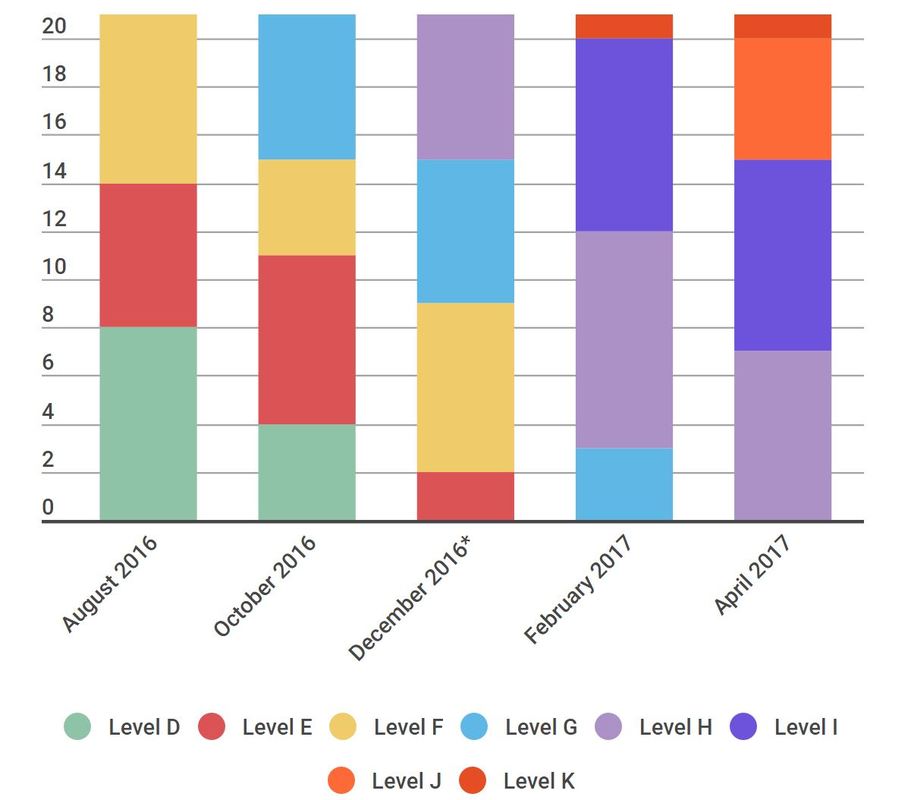
The data to the left shows the change in guided reading levels from the beginning of the school year in August, through the end of the action plan period in April. The initial lack of growth in reading levels from August to October, with many students right at or below the proficient level of "E" in October, was cause for concern. After the action plan was created at the end of December, the growth in reading level over the course of the action plan period was great. The data showed me that students definitely grew in their reading abilities, but it still remains questionable whether students made the growth through my specific instruction, or from natural progression of reading due to exposure to more words, books, and skills. It also shows all of the students in my class, not just the 10 students from my reading groups, so the effects of the other reading teacher's instructions must be questioned also. As a reading teacher, I had to always monitor student learning, both the students in my reading groups and the rest of my students, which supports Core Proposition 3, "teachers are responsible for managing and monitoring student learning." By monitoring all 21 students, I was able to determine if any students needed to be switched from reading group or move levels every few weeks.
|
|
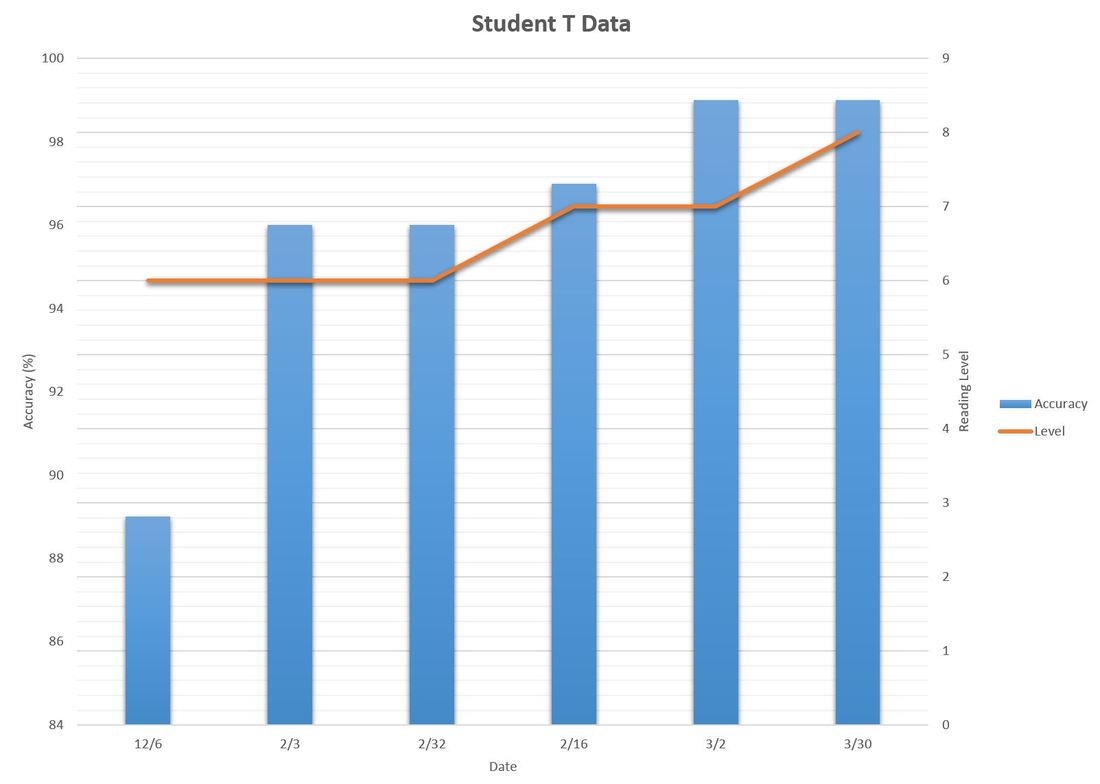
The chart to the right shows an example of one student's running record data throughout the action plan. Initially, Student T had a low percentage of accuracy while reading. As the student's reading level increased over the course of the action plan, the accuracy percentage increased also. This is another example of Core Proposition 3, as I managed and monitored this student's learning through running records to track reading growth.
|
|
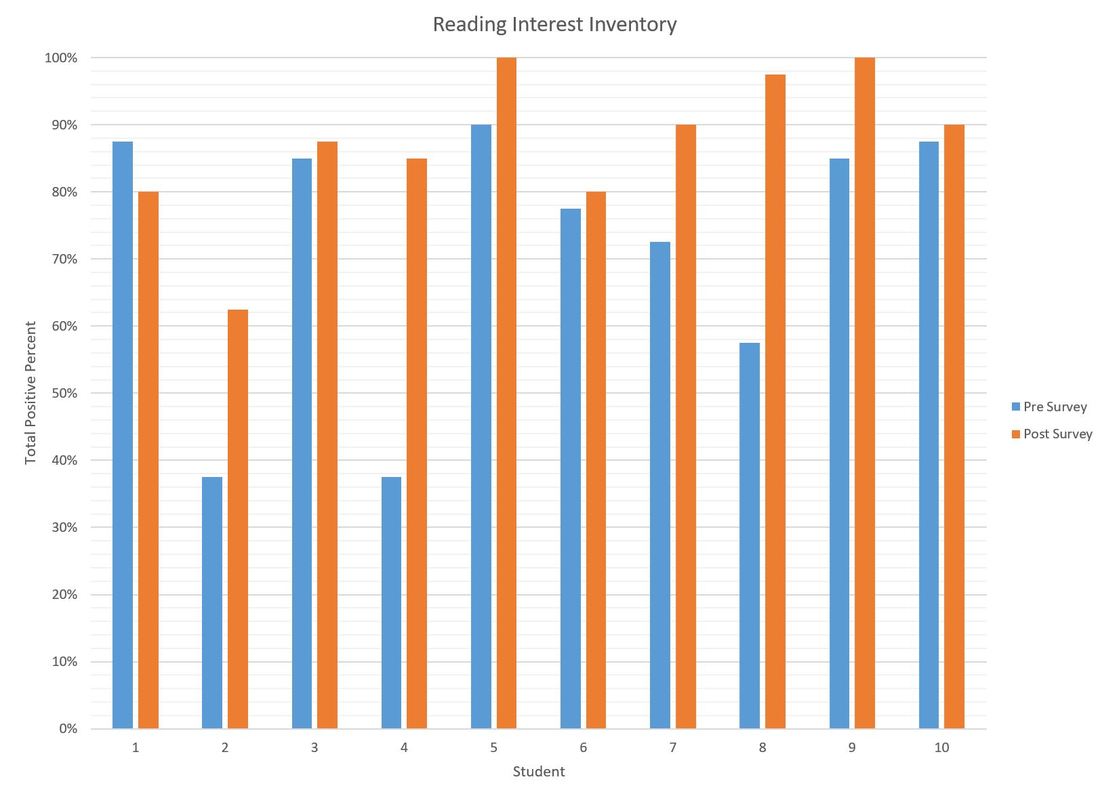
Reading Interest Inventory
|
|
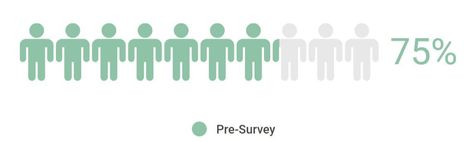
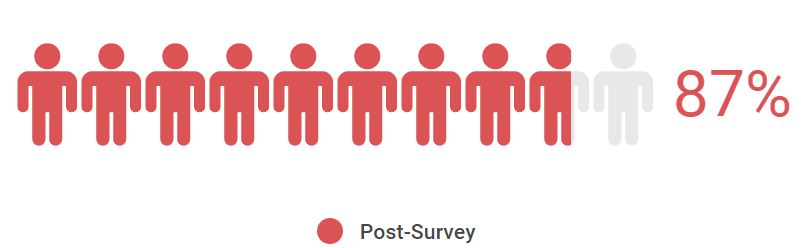
Students participated in a pre- and post-reading interest survey, which asked questions on overall feelings towards academic and personal reading. The average score on the pre-survey was 75%. The average score on the post-survey was 87%. This data indicates that the overall positive feelings about both academic and personal reading increased by approximately 12% from the start of the action plan to the conclusion. The importance of this survey supports Core Proposition 1, as I am committed to students and their learning, both as personal interest in the subject of reading and of the growth in reading abilities. By understanding the students and their interests, I was able to better pick the books and activities for each lesson.
|
This graph breaks down the 10 target students and compares each student's overall feelings about reading before the action plan and after. 9 out of 10 students saw positive growth from the pre- to post-survey results. The data lead me to believe that students felt more comfortable with and more interested in reading after more exposure to quality guided reading groups.
|
